What makes people accept AI in place of a person? What a Journal of Marketing study found
Put an AI and a human on the same task and most people lean, just slightly, towards the human. Pooling 136 experiments, this meta-analysis shows which design choices shrink that lean and which ones make it worse.
Li et al. pool 287 results from 136 experiments: people lean slightly towards humans over AI, but capable, advisory, general-purpose AI narrows the gap.
Marketing in 3 · 2025 in research · No. 25 · Paper published 21 June 2025
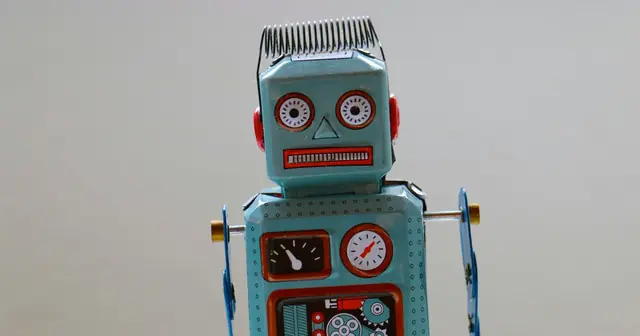
The app suggests the route and the driver keeps the wheel, the kind of AI people find easiest to accept. Photo: Paul Hanaoka on Unsplash.
The short answer
Mostly proof that it does the job better, and a role that leaves people in charge. Combining 136 experiments, 287 comparisons and 119,358 participants, the researchers found a small but reliable lean towards humans over AI doing the same task. That lean shrank when the AI was billed as better at the task than people, gave advice instead of acting alone, or covered many kinds of task. Giving it a humanlike face or way of speaking widened it.
Evidence level
★★★One study
★★★Several studies
★★★Meta-analysis
Key takeaways
AI presented as more capable than a person raised acceptance by 13.15%, the biggest lift of any design feature.
Advisory AI that leaves the decision to people had a 9.36% edge in acceptance over AI that acts on its own.
A general-purpose AI was 7.79% more likely to win acceptance than one built for a single domain.
Women were not warier of AI: in samples that were about 50% female on average, the share of women made no difference to acceptance.
What the researchers did
Bingqing Li at the University of Missouri and
Edward Yuhang Lai at The Hong Kong Polytechnic University, together with
Xin (Shane) Wang at Virginia Tech,
wanted to know which features of an AI system make people willing to use it instead of a person.
They start from two ways of seeing AI. As a tool, it is judged like any new technology: is it useful, easy to use
and worth the cost? As an agent, it is judged more like a colleague who can decide and act: how much control does it
take, how human does it seem, what role does it play? Some features should help under one view and hurt under the
other, so the team weighed both at once.
They pooled the experiments that set AI against a human doing the same task, from investment tips and matchmaking to
medical, court and hiring decisions. Each comparison was coded for nine features a firm can design in, which the
authors call engineerable: capability, two kinds of transparency, reliability, humanlike design, breadth of
expertise, how much the user takes part, the AI's role and its cost. Task, user and method details were coded too,
so every feature could be judged with the others held equal.
Evidence base
287 effect sizes from 136 experiments in 61 articles, covering 119,358 participants
Search
2,488 articles screened from a business database, three reviews of algorithm aversion and extra searches
Included
Experiments comparing AI with a human equivalent, in outlets ranked in the top half of their field by impact factor
Outcome
Acceptance of AI, as attitudes (favourable views, comfort relying on it) or behaviour (intending or choosing to use it)
Method
Three-level random-effects models, then one meta-regression with every feature and control entered together
Extra
A free interactive web tool lets readers rerun subgroups and add new results
Reading the numbers in plain words
Every result is a standardised gap called Cohen's d. Take the average response to the AI, subtract the mean
response to the person, and divide by how widely responses varied. Zero means people treated the two alike. A
negative value means they leaned towards the person, a positive one that they leaned towards the AI. A d of minus
0.2 would put the typical response to AI a fifth of a standard deviation below the response to a human.
How big is big? A widely used rule of thumb in the social sciences, a general convention not stated in the paper,
counts 0.2 as small, 0.5 as medium and 0.8 as large. The overall lean found here falls short of even the
small mark.
For each design feature, the authors report how far it moved that gap when present, with everything else held
equal. They also translate the main ones into a plainer measure, the common-language effect size: the chance that a
response drawn at random from the AI condition beats one drawn from the comparison. An even chance is 50%. So when
the paper says a feature makes AI 10% more likely to be accepted, read it as 60 in 100 instead of 50 in 100.
A small lean towards people
Pooled across all 287 results, people responded a little less warmly to AI than to a human in the same role. The
gap is small but statistically solid: its 95% confidence range runs from 0.08 to 0.22 in the person's favour and
never reaches zero. It showed up in opinions and in choices alike, and those two kinds of measure did not differ
reliably.
The average hides a wide spread. Single results ran from 2.04 in favour of the person to 1.53 in favour of the AI,
and 93.3% of the variation reflected real differences between studies rather than chance. That spread is why the
features matter.
Where Katja Gelbrich and colleagues' meta-analysis of robots, chatbots and algorithms asked when a machine can
replace staff as an equal, this one looks for the features, judged through both lenses, that draw people towards
using AI at all.
How far responses to AI fell below responses to a person (Cohen's d; 0 = no difference)
How far responses to AI fell below responses to a person (Cohen's d; 0 = no difference)
Group
Value ()
All 287 results
0.15
Attitudes (127 results)
0.122
Behaviour (160 results)
0.174
Intercept-only three-level models across all 136 studies. Attitudes and behaviour do not differ significantly from each other (p = .738); each gap is significantly different from zero.
What makes AI easier to accept
Capability mattered most. When the AI came across as abler than a human at the task, acceptance rose by
almost half a standard deviation (0.475), the largest shift in the model. Only 21 of the 287 comparisons featured
such an AI, a reminder that few experiments have pitted people against a clearly superior machine.
Breadth helped too, against one of the two predictions. The tool view expects people to prefer a versatile,
general-purpose AI. The agent view expects them to want a specialist, the way a patient would rather see an
endocrinologist than a general practitioner. The generalist came out ahead (a shift of 0.278), which the authors see
mirrored in the success of ChatGPT.
Openness about inputs gave a smaller lift. Telling users which data the AI draws on raised acceptance by 0.143,
narrowly missing the conventional 5% significance cut-off (p = .062). Explaining how the AI turns that data into an answer showed
no clear effect.
What makes it harder
Handing the AI the final say cost acceptance. Just over half the comparisons, 153 of 287, involved AI that carried
out the task with little or no human input; the rest had AI giving advice the person was free to ignore. People were
warier of the doers. The authors link this to a sense of losing control, and to people feeling replaced rather than
helped.
Humanlike design backfired. Only 18 comparisons featured AI with a human look or humanlike language, but those
systems were accepted clearly less than plainer ones. The authors' explanation: an imitation that is close but not
perfect makes the missing humanity more obvious, the discomfort known as the uncanny valley.
The task weighed as heavily as the design. AI was accepted less for decisions with a moral side, such as court rulings
or hiring, and for tasks that handle sensitive personal data, such as medical ones. Tasks whose outcomes spill over
onto other people made no measurable difference.
How far each feature lowered acceptance of AI (Cohen's d; 0 = no change)
How far each feature lowered acceptance of AI (Cohen's d; 0 = no change)
Group
Value ()
Humanlike look or language
0.376
AI acts with little human input
0.335
Task uses sensitive personal data
0.228
Task involves a moral judgment
0.204
Full multivariate model (Table 4), all 287 effect sizes, every other feature and control held equal; all four shifts are statistically significant.
Tool or agent? A split verdict
Several features were framed as tests between the two views of AI, and the results split. Breadth of expertise
sided with the tool view. Role and humanlike design, features the authors place under the agent view, were among the
strongest effects. Human involvement, where the two views pointed in opposite directions, came out flat, whether
people simply pressed go or worked back and forth with the system. Reliability, meaning consistent results with few
errors, made no difference either.
User characteristics mattered little too: age made no difference, and samples of students looked like everyone else. The
authors conclude that the agent view deserves far more attention as AI systems start to plan and act on their own,
and they call for studies that test directly whether people see a given AI as a tool or as an agent.
Marketing in 3 steps
Ready. Set. Market.
1
ReadyDecide and prepare
Find the jobs your AI does better. List the tasks your AI feature handles. Pick the two or three where your own tests show it beats a person on speed or accuracy, and lead your launch copy with one concrete comparison for each, such as an answer in ten seconds instead of a day.
Let people make the final call. For each task, decide whether the AI suggests or acts. Start with suggestions the customer approves with one click, and put a confirm button in front of any step that spends money or sends a message on their behalf.
2
SetBuild it
Say which data it uses. Next to the AI feature, add one plain sentence naming the data it draws on, such as past orders or the question just typed. Keep it under 25 words and link it to your full privacy note.
Use a plain icon, not a human face. Give the assistant a clean, product-like look instead of a human avatar or a chatty persona. Spend the design budget on faster, more accurate answers, and let one assistant cover many kinds of request rather than building a separate bot for each.
3
MarketLaunch and measure
Go slowly on sensitive tasks. Launch on everyday tasks that touch no personal data first. Where the AI deals with health, money records or judgements about people, such as hiring, keep a named person in the loop and say so on screen.
Promote it widely, then watch real use. Do not narrow ad targeting for an AI product by gender on the guess that women are warier. Run the campaign broadly and judge it by how many people try the feature and are still using it 30 days later, not by survey scores alone.
Found this useful?
Marketing in 3 is free and ad-free, with new issues every Monday and Thursday. A coffee keeps it that way.
Choices can trail opinions. With the other features held equal, acceptance measured through what people did came out lower than acceptance measured through what they said (a gap of 0.266), so a warm survey may flatter real uptake.
A stake in accuracy helps. In experiments that rewarded people for getting the answer right, acceptance of AI was higher by 0.360. Our extrapolation: where customers gain from a correct answer, show how the AI helps them reach it.
Slightly warmer in English-speaking markets. Studies run in the United States, Canada and the United Kingdom showed a little more acceptance (0.191) than those run elsewhere, so test before assuming a result travels.
Norms may beat persuasion in sensitive areas. For moral and privacy-heavy uses, the authors suggest winning over the people who make society-level decisions, expecting individual acceptance to follow once use becomes normal.
Where it does not work
Mostly imagined. Seven results in 287 came from real-world use; the rest asked people to react to hypothetical scenarios.
Thin data on two features. Just 7 results involved explaining how the AI works and 8 an explicit price, so those findings are the least settled.
Limited to what studies reported. Features such as personalisation, and user traits such as prior AI experience, education or social influence, could not be coded, so their role is unknown.
Light double-checking. Two coders cross-checked 54 effect sizes and agreed a scheme; one coder then coded the rest.
Patterns across studies. A caution of ours rather than the authors': each feature's effect comes from comparing different experiments, not from varying it inside one, so the results show where acceptance ran higher, not proof that the feature caused it.
Questions marketers ask
Do people prefer a human to AI?
Slightly, on average. Across 136 experiments people responded a bit less favourably to AI, compared with a human handling the same task, a reluctance the authors call small but robust. It has also been easing, with more recent studies showing higher acceptance (Li et al., 2026).
Should an AI assistant look or talk like a person?
This evidence says no. Humanlike looks and language lowered acceptance. Their advice: put the effort into making the AI more capable, and into saying clearly where it outperforms people, rather than into a humanlike interface.
Is a paid AI service accepted more than a free one?
Possibly. In the main model, AI that came with an explicit cost in money or points was accepted more than free AI, consistent with people reading a price as a sign of competence. The authors flag the finding as unstable: it shifted across their robustness checks and leaned on a few results.
Does AI acceptance differ for business users and consumers?
Overall acceptance was about the same in professional and consumer tasks. What differed was sensitivity to design: consumers responded more strongly to capability, data transparency, humanlike design, role and cost, while professionals warmed more to general-purpose AI. The authors speculate that consumer uses involve more personal data.
Three experiments, with 156, 168 and 313 participants, compared real and virtual celebrities joining a brand's live stream as co-hosts. Real stars won more engagement and deeper emotional attachment, and viewers were more willing to keep watching and to buy. Virtual stars did better when the product was a search good, one shoppers can size up from its details. Before booking a digital celebrity for a stream, ask whether the product could sell on its specs alone.
A decade of International Women's Day posts from the 100 most valuable brands on Twitter/X shows women liking, reposting and replying more than men, above all with brands aimed at them. Posts coded as authentic drew fewer likes and reposts than the rest, a pattern the authors take as a sign that the day is treated as a moment to celebrate rather than to debate commitments. A celebration day may call for a celebratory tone, with the record of real action shared on the other 364.
Source
Li, B., Lai, E. Y., & Wang, X. (2026). From Tools to Agents: Meta-Analytic Insights into Human Acceptance of AI. Journal of Marketing, 90(3), 13-33. https://doi.org/10.1177/00222429251355266
This brief is written for practitioners from the published article. Open access (CC BY-NC 4.0): free to read at the publisher. Numbers are as reported by the authors; read the article for full methods.
Pizzi et al. find a chatbot avatar that looks straight at shoppers seems warmer, and lifted the share who put travel insurance in the cart from 42% to 52%.
Fang et al. tested keep-it partial refunds on 853,521 online shoppers: the first return cost more, but later spending left a net gain of $1.44 per customer.
A survey of 238 people and 36 interviews show a failed brand chatbot hurts feelings and trust through the brand, and behaviour through the bot.
Bruno Schivinski is Associate Professor of Marketing at Gdańsk University of Technology. He studies how consumers engage with brands in digital and social media.