Can phone location data predict where people shop, without constant tracking? What a Journal of Interactive Marketing study found
Most location targeting still draws a circle around a store and waits for phones to enter it. Location records kept only near businesses in one New York borough show that a driver’s recent routes help predict where they will buy fuel, even once price, brand and habit are known.
Shoshani et al. find that drivers’ recent routes, rebuilt from phone sightings near shops, help predict which fuel station they pick beyond price and habit.
Marketing in 3 · 2023 in research · No. 28 · Paper published 20 July 2023
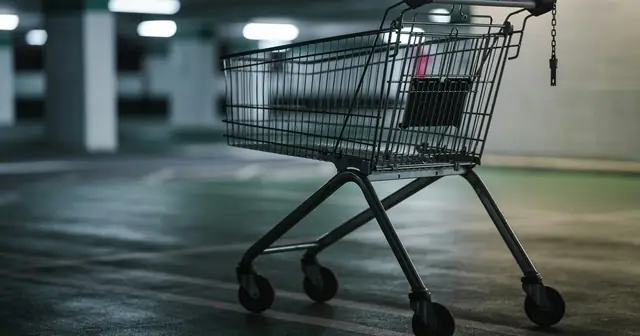
Daily routes decide which stores people pass, and often which ones they pick. Photo: Josh Hild on Unsplash.
The short answer
It can help. Using phone location records collected only near shops on Staten Island, New York, the researchers rebuilt each driver's usual routes from the five days before a fill-up. For 903 regular drivers, knowing how far each station sat from those routes improved predictions of where they bought fuel, on top of price, brand and past visits. Drivers would add only about 21 metres to their route for each cent saved per gallon.
Evidence level
★★★One study
★★★Several studies
★★★Meta-analysis
Key takeaways
Drivers were about 7 times more likely to return to the station they used last than to pick any other station.
Adding recent routes raised the share of fill-ups where the model named the right station from 39.37% to 41.83% in weeks it had not been trained on.
About 30% of drivers fuelled up almost only along their usual routes and would detour about 7 metres per cent saved; the other 70% would go 38 metres.
Counting shop sales and likely repeat visits, a newly won customer was worth between $3.00 and $7.59 to a station.
What the researchers did
Tal Shoshani of the University of Southern California,
Peter Pal Zubcsek and
Shachar Reichman, both of the Coller School of Management at Tel Aviv University,
looked at how retailers use the location data that phones produce. Most still rely on geofencing: an offer goes out
when a phone enters a set radius around a store. Everyone inside the circle is treated alike, wherever they came from
and wherever they are heading.
Richer methods follow people's movements through the day, but they need location data recorded at very short intervals. Data that
fine can reveal visits to clinics or places of worship, so many location data firms keep only sightings near businesses
that matter commercially. The team asked whether such sparse records can still show where people will buy.
Fuel was the test case. A location intelligence company shared records from Staten Island, New York, covering 24 weeks
from 13 November 2017 to 29 April 2018. Daily prices for regular fuel at each station came from the Oil Price
Information Service.
Setting
Staten Island, New York: 43 of the island's 69 fuel stations plus 123 other shops, such as drugstores, discount stores, coffee chains and fast food outlets
Data
1.06 million sightings of 26,853 phones, logged only when a phone came within 100 metres of an indexed site
Fill-up rule
A phone within 16 metres of a station for between 120 and 1,500 seconds
Analysed
903 regular drivers, 62,810 driver-days and 1,227 fill-ups
Method
Choice models of which station, if any, each driver used each day, weighing price, distance from recent routes, brand and habit
From scattered sightings to a usual route
Each phone's sightings on a given day, counted from 4 a.m., were put in time order and joined by the shortest driving
path, using OpenStreetMap road data. A station's distance from that day's path was the shortest drive to it from any
point along the way.
A single day's sightings are patchy, so the team averaged this distance over the five days before each day being
explained. If a station sat 0.2 km off one day's path and 0.3 km off another's, its distance from the driver's expected
route was 0.25 km.
To keep only people who buy fuel locally, they dropped phones with fewer than two fill-ups over the period, and phones
that seemed to fill up on consecutive days, which real refuelling rarely looks like. They also left out the five days
after each fill-up, so a trip to the pump could not shape the route used to explain the next one.
Habit first, but the route still matters
The main model weighed each day's choice between the 43 stations and not buying at any of them. Habit was very
strong, as the takeaways show. Even so, a higher price and a longer detour from the expected route both made a station
a less probable choice, and the detour mattered less at stations a driver already favoured.
Adding the route measure improved the model considerably. McFadden's pseudo R², a standard fit measure for choice
models where higher means a closer fit, rose from .0760 to .1149.
Setting price against distance gives the trade-off in the short answer. It held when the team controlled for
market-wide changes in demand from day to day (23 metres per cent) and when each phone got its own baseline rate of
filling up (about 27 metres, on 704 drivers). Other definitions of a fill-up and of the route led to similar
conclusions.
Two further results matter for targeting. Drivers were slightly less sensitive to price at stations within 50 metres of
any of their five recent routes. And routes recorded on weekdays explained fuel choices better than weekend routes did,
even for fill-ups at weekends.
Extra metres a driver would add to the usual route for each cent saved per gallon
Extra metres a driver would add to the usual route for each cent saved per gallon
Group
Value ()
Route-bound drivers (about 30%)
7
All 903 drivers, main model
21
Loyal drivers (about 70%)
38
Main conditional logit model and the two-class latent class model, both on 903 drivers and 62,810 driver-days (Tables 4 and 7).
Two kinds of driver
People differ, so the team also let the model sort drivers into groups by the way they chose. Two groups fitted best.
In the larger one, 625 drivers, distance from the route counted for less and habit was strong: a driver was about six
times as likely to pick the station used last as any other. In the smaller one, 278 drivers, distance weighed over five
times as heavily, habit was weaker at about 3.3 times, and drivers changed stations more readily between fill-ups.
A second check gave each phone a likely home zip code, taken from the shop where it was most often seen last thing in
the day, with no home address involved. Phone counts per zip code tracked census population closely (r = .70). A longer
detour lowered the chance of choosing a station in all 12 of the island's zip codes, but giving each area its own
sensitivity added little to the model.
Tested on weeks the model had not seen
The team then trained the models on the first 16 weeks and tested them on the last 8, which held 20,196 driver-days.
Measured over all driver-days, about 98% of which ended with no fill-up at a tracked station, the model with
routes fitted the new weeks significantly better than the one without.
They also took the 447 fill-ups in the test weeks one by one and asked which station each driver had used. Always
guessing the station most popular in those weeks would rarely have been right. Habit alone did far better, and route data
improved on that.
Share of test-week fill-ups where the right station was named
Share of test-week fill-ups where the right station was named
Group
Value (%)
Most popular station's share
8.05
Model without route data
39.37
Model with route data
41.83
Out-of-sample test on the 447 fill-ups in the last 8 of the 24 weeks; both models trained on the first 16 weeks.
What a new customer is worth
To show how a station could use the model, the authors priced a newly won customer: the most a station should pay to
attract one, for instance through mobile search ads. Three parts went in: profit on the fuel, profit from the shop and
the chance of coming back.
Fuel profit used an average fill of 11.7 gallons and an assumed 9% gross margin, which gave $0.12 to $0.46 per gallon
depending on brand and day. For the shop, industry figures that 29% of fuel customers buy something, spending $8.83 on
average at a 40% margin, came to $1.02 per visit. The model then estimated how much one fill-up raises the probability that
the driver comes back: by 0.12 to 0.35 depending on the station, 0.22 on average. Combined, these give each station its own value
for a new customer, the range shown in the takeaways.
Privacy, and what the authors suggest
The method needed neither continuous tracking nor home addresses, only sightings near ordinary businesses and past
fill-ups. The authors expect the location data open to retailers to become sparser as providers drop sensitive places.
They cite a provider that, after a lawsuit from the US Federal Trade Commission, began blocking sales of data collected
at clinics, places of worship, schools and similar sites.
For fuel retailers, they suggest setting the value of a new customer against what it costs to win one through mobile
search ads or targeted promotions. They also propose that the approach could serve sectors where promoted prices are
prominent to shoppers, such as clothing retail or fast casual dining, with real-time or next-day offers for people whose
usual route makes the trip easy. Location data providers, in their view, could run such analyses for retailers in a way
that protects privacy. None of these uses was tested here, and the authors leave field experiments with mobile offers to future work.
Marketing in 3 steps
Ready. Set. Market.
1
ReadyDecide and prepare
Map the places your customers pass. List the roads, stations, supermarkets and gyms near each store that your customers pass on ordinary days. Use opted-in app data, loyalty check-ins or a ten-question customer poll. Aim for five to ten places per store.
Ask for less location data, not more. Tell your location data supplier you only need sightings near shops and other everyday businesses. Ask in writing for homes, health services, religious buildings and schools to be left out. Check that clause every time the contract renews.
2
SetBuild it
Build a five-day route for each customer. For customers who have opted in, put the places they were seen in the last five days in time order. Join them on a map and measure how far each of your stores sits from that path, in metres of driving or walking.
Target by route instead of a circle. Send offers to people whose usual route passes within 500 metres of a store, rather than to everyone who enters a radius around it. Time the message for the evening before or the morning of a weekday trip.
3
MarketLaunch and measure
Cap what you pay for a new customer. Add the profit on one typical purchase to the profit on extras bought on the same visit. If about one new customer in five comes back, multiply the total by 1.25. Never pay more than that figure to win a customer through ads or coupons.
Compare with a group that gets nothing. Run the route-based offer for four weeks. Hold back one eligible customer in ten, chosen at random, who gets no offer at all. Compare store visits per 100 customers in the two groups before you spend more.
Found this useful?
Marketing in 3 is free and ad-free, with new issues every Monday and Thursday. A coffee keeps it that way.
Habit sets the baseline. Most customers keep using the store they used last time, so route data adds a modest gain in accuracy rather than a new picture.
Short detours only. Price cuts mostly win customers whose routes already run close to the store, not people from across town.
Two kinds of customer. Plan for a smaller group that buys strictly along its route and switches stores readily, and a larger, more loyal group that will go a little further for a familiar store.
Modest sums per head. In fuel, a new customer was worth a few dollars, so acquisition spend per customer has to stay low. Categories with larger baskets may justify more, though that extension is ours and was not examined.
Where it does not work
One category, one island. Fuel on Staten Island over 24 weeks in 2017 and 2018. Shoppers in other categories or cities may weigh distance differently.
Visits inferred, not sales. Fill-ups were inferred from how close a phone came to a station and how long it stayed. No receipts were seen, and the amount of fuel bought was unknown.
Some drivers are easier to see. The authors add that the fill-ups they could detect may lean towards very loyal drivers and people often near the tracked shops.
The value figures rest on assumptions. The per-customer values use an assumed fuel margin and industry averages for fill size and shop spending, not each station's own accounts.
No offers were sent. The study models choices from observed data. Any gain from route-based targeting is the authors' suggestion, still to be tested in field experiments.
Questions marketers ask
Can location data from phones show which store a customer will choose?
Partly. In fuel buying on Staten Island, adding each station's distance from a driver's routes over the previous five days improved predictions of the station chosen, over and above what price, the station's brand and the driver's habits already explained, both within the estimation weeks and on later weeks (Shoshani et al., 2024).
How does geofencing work, and where does it fall short?
It sends an offer to any phone that crosses into a defined area around a store. The authors argue it treats everyone at a spot alike, although different people at the same place may respond to one offer in different ways. Following routes over several days is their alternative.
How far will drivers detour for cheaper fuel?
Not far. Across the model variants and checks, a saving of one cent per gallon was worth between 4 and 44 metres of extra driving for stations within 10 km of a driver's expected route.
Does location-based marketing require constant tracking?
Not in this study. Phones were logged only when they came close to a fixed list of fuel stations and everyday shops, none of them sensitive places, and no home addresses were used. Those scattered sightings were enough to build workable routes.
Would this work for shops other than fuel stations?
It has not been tested. The authors suggest it could suit businesses where shoppers notice promoted prices, for example clothes shops or fast casual restaurants, but they caution that the patterns found, especially the differences between drivers, may be specific to fuel.
Firms gather customer data from transactions, loyalty schemes and social media, and every extra source can stir privacy and security worries. Three prediction experiments looked at three features of a data source: how much data it holds, how detailed it is and what it contains. Each feature helped indicate how accurately the source predicted customers' psychographic traits and behavioural intentions, so more data was not automatically better. Choosing sources by the insight they yield can keep both collection and relationship risk down.
A large European insurer provided a natural test of three ways to move customers off the phone. Compared with letting customers pick their channel freely, making the phone line less visible did not raise churn, while removing it outright raised churn by 11.27 percentage points, a relative increase of 47%. The authors' calculations show the less visible phone line delivering higher customer lifetime value than removal. When steering customers online, making an old channel less prominent appears safer than closing it.
Source
Shoshani, T., Zubcsek, P. P., & Reichman, S. (2024). Analyzing Purchase Decisions Using Dynamic Location Data. Journal of Interactive Marketing, 59(1), 1-18. https://doi.org/10.1177/10949968231179148
This brief is written for practitioners from the published article. Open access (CC BY-NC 4.0): free to read at the publisher. Numbers are as reported by the authors; read the article for full methods.
A "recommended for you" weight-loss refill lowered ratings of the pharmacy from 3.79 to 3.02 out of 7. When personalization embarrasses customers, and what to do.
Carts with more indulgent items are abandoned more often. Recommending a practical add-on cut abandonment from 4.61 to 3.64 out of 7. Here is how to use it.
Bruno Schivinski is Associate Professor of Marketing at Gdańsk University of Technology. He studies how consumers engage with brands in digital and social media.