Did social media ads help small businesses survive lockdowns? What a Journal of Interactive Marketing study found
When stay-at-home orders emptied the high street, more small firms shut for good. Data spanning 49 countries suggest those already advertising on Facebook took a noticeably smaller hit.
Lee et al. find stay-at-home orders raised business closures less among Facebook advertisers, in data on more than 79,000 firms across 49 countries.
Marketing in 3 · 2025 in research · No. 15 · Paper published 15 April 2025
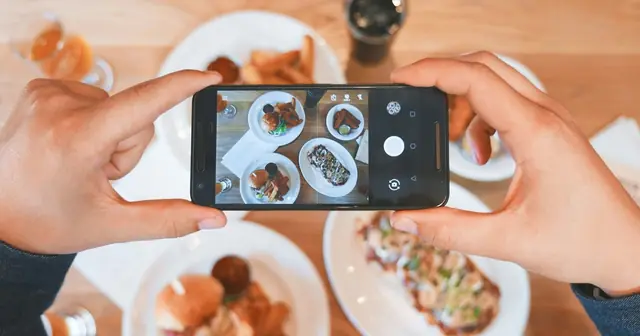
A one-person workshop has no marketing department, only an owner deciding whether the ad budget survives a bad month. Photo: HENG YIN on Unsplash.
The short answer
It looks that way. Lee and colleagues followed more than 79,000 businesses in 49 countries from December 2019 to May 2020, matching survey answers on whether each was open with its real Facebook ad records and the timing of national stay-at-home orders. Lockdowns made closing more likely everywhere, but less so for firms that had been advertising, and least for the biggest spenders. The data show a consistent pattern, not proof of cause.
Evidence level
★★★One study
★★★Several studies
★★★Meta-analysis
Key takeaways
On average, a stay-at-home order raised a firm's chance of closing by 2.9 percentage points, and the effect grew from 2.2 points in the month it began to 11.5 points four months later.
Three months into a lockdown, the added risk of closing was 5.1 points for firms with no Facebook ads in early 2019 and 3.3 points for those that had run them, about a third lower.
Among advertisers, the fifth that spent most faced less than half the added risk of the fifth that spent least: 2.0 against 4.3 points.
Before any modelling, 15% of non-advertisers had closed by May 2020, compared with 12% of advertisers.
What the researchers did
Shun-Yang Lee and Yakov Bart of the D’Amore-McKim School of Business at Northeastern University,
Julian Runge of the Medill School of Journalism at Northwestern University, and
Daniel Yoo, Anett Gyurak and J.W. Schneider of Meta Platforms took on a question many shop owners
faced when the first lockdowns arrived. If customers are ordered to stay home, is advertising still worth paying for?
Answering it needed data that rarely sit together. Whether each business was open or shut in a given month came from the
Future of Business Survey, which the World Bank, the OECD and Facebook ran with firms on the platform. What each firm
actually spent on Facebook ads came from the platform's own records rather than from owners' memories. The timing of
lockdowns came from the Oxford COVID-19 Government Response Tracker, with a month counted as locked down if an order
applied on at least one day.
Countries closed their doors in different months, and some never did. That let the team compare how closures moved in a
country once its order began with countries that were still open at that point, a design economists call staggered
difference-in-differences. They ran the analysis once for advertisers and once for everyone else, then compared the results.
Businesses
79,117 firms in 49 countries, 51,977 of which had run Facebook ads and 27,140 had not
Size
83% had fewer than 10 employees; services and retail were the largest sectors
Period
Each month, December 2019 through May 2020
Outcome
Whether the business was closed that month, from survey answers
Advertising
Real ad activity and spend logged by Facebook, not self-reported
Held constant
National income per head, firm size and number of Facebook fans
How hard lockdowns hit
The raw curves already told much of the story. The share of closed businesses jumped in the month an order took effect
and kept rising after it. The models confirmed it: a simpler linear version put the average lift in closure risk at 3.6
percentage points, close to the main estimate, and the damage deepened the longer an order stayed in place.
One detail suggests owners saw trouble coming. A second estimation method found closures already edging up a month before
orders began, and that early rise came mostly from firms that were not advertising.
Advertisers took a smaller hit
The core comparison split firms by whether they had advertised on Facebook in the first half of 2019, long before anyone
had heard of the virus. In every month after an order, both groups became more likely to close. For advertisers the rise
was smaller each time, and the gap kept widening until the third month.
A second split looked at advertising in the two months before each month observed, with matching results. Three months
into lockdown, closure risk was up 8.0 points for non-advertisers against 6.2 for advertisers. Four months on, risk had
jumped above nine points in every group and the gap had narrowed to between half a point and just over one. A stricter
check that compared each firm only with itself kept the overall gap, 3.4 against 3.0 points, but gave mixed results
month by month.
Added risk of closing after a stay-at-home order, by Facebook advertising in early 2019 (percentage points)
Added risk of closing after a stay-at-home order, by Facebook advertising in early 2019 (percentage points)
Group
Value ()
Month of the order, no ads
2.6
Month of the order, advertisers
2.1
One month on, no ads
3.2
One month on, advertisers
2.6
Two months on, no ads
3.9
Two months on, advertisers
3.0
Three months on, no ads
5.1
Three months on, advertisers
3.3
Main model (extended two-way fixed effects, logit), 79,117 businesses in 49 countries, Table 4. Advertiser status from the first half of 2019.
Bigger budgets, smaller hit
Spend told a steadier story than a simple yes or no. Among advertisers, each step up the budget ladder went with a smaller
lockdown effect. Counting how many ads a firm ran, rather than what it paid, pointed the same way.
An obvious objection is that healthier firms can afford more advertising and would have survived anyway. To get around
it, the team replaced each firm's own spend with the average spend of its competitors in its own industry and country.
That figure tracks how much businesses like it advertise without reflecting any one firm's private fortunes. The pattern
survived: 3.3 points of added risk in the lowest group against 1.8 in the highest, although the estimates for the two
top groups were too imprecise to rule out no effect at all.
Advertisers only: added risk of closing after an order, by own Facebook ad spend (percentage points)
Advertisers only: added risk of closing after an order, by own Facebook ad spend (percentage points)
Group
Value ()
Lowest-spending fifth
4.3
Second fifth
3.1
Middle fifth
2.5
Fourth fifth
2.2
Highest-spending fifth
2.0
Advertisers split into five equal groups by their own ad spend, same model and controls, Table 8, row 1.
Who gained most
The smallest firms, the bulk of the sample, showed the clearest difference. Read from the paper's chart, a lockdown added
roughly 3.4 points of closure risk for tiny businesses that did not advertise and about 2.6 for tiny ones that did. Among
firms with 500 or more staff the two groups sat almost level. The authors treat these size splits as directional, since
the ranges around each estimate overlap a good deal.
Sectors varied too. Retail and construction appeared to benefit most from Facebook advertising, transport hardly at all,
and in agriculture, around 2% of the businesses, advertisers fared slightly worse. In every other sector advertisers came
out ahead.
Advertising as a kind of insurance
Why would ads bought before a crisis help during one? Earlier studies cited in the paper show that advertising
works with a delay and builds assets that never appear on a balance sheet, such as recognition and a following of
engaged customers. Targeted social ads, they argue, are well suited to building those assets, which can then carry a
firm when footfall vanishes. Their careful phrase is that ad technology may act as insurance against sudden demand shocks.
That runs against instinct. Firms have historically trimmed marketing when the economy turns. The authors' view is that
holding or even raising social spend in a crisis may be the better call. They go further, proposing that
governments could subsidise small firms' social campaigns in a downturn and that lenders could offer credit to keep
them running. Those ideas are the authors' proposals; the data did not test them.
Marketing in 3 steps
Ready. Set. Market.
1
ReadyDecide and prepare
Set a floor for your ad budget. Decide the smallest weekly ad budget you would keep running even if sales halved. Write the amount down and agree it with whoever signs off spending.
Put three months of it aside. Keep three months of that floor budget in a separate pot, away from stock and wage money, so the ads do not stop the week cash gets tight.
2
SetBuild it
Keep one campaign always on. Run one small campaign on the social platform your customers use most, aimed at people within easy reach of your shop or delivery area. Leave it running every week, good or bad.
Write your closure posts now. Draft four short posts for a forced closure: how to order, delivery or pickup times, new opening hours, and a thank-you to regulars. Save them with photos, ready to publish.
3
MarketLaunch and measure
Switch the message within two days. When footfall drops, swap your ads to those posts within 48 hours. Keep spending at or above the floor for a full eight weeks before you judge the results.
Log orders against spend weekly. Every Monday, note orders, enquiries and ad spend on one sheet. After eight weeks, move money from the weakest ad to the one that brought in the most orders.
Found this useful?
Marketing in 3 is free and ad-free, with new issues every Monday and Thursday. A coffee keeps it that way.
Protection, not immunity. Advertisers still closed more often once an order began. Their added risk was smaller, not absent.
The cushion builds over months. The difference between advertisers and the rest grew through the first three months of an order.
Spend level matters. Risk rose less at each step up the spending ladder, which suggests, as our own inference, that a token budget buys less cover than a steady one.
Small firms first. Businesses with fewer than ten people showed the clearest gap; for the largest firms advertising made little visible difference.
Where it does not work
A pattern, not proof. The authors stress that their results are correlational. Firms that advertise may be healthier, older or better run in ways the data do not record.
One platform. Only Facebook advertising was observed, so search, display or offline ads are invisible here.
Only lockdowns modelled. Governments also brought in other economic and health policies, which the analysis left out.
Six months of data. The window closes in May 2020, so it says nothing about recovery or later waves.
Reached through Facebook. The survey ran on the platform, so firms with no presence there are unlikely to be in the sample.
Ties to the data source. The ad records came from Meta. The paper declares that two authors work there, a third used to, and a fourth was employed by Facebook before the company was renamed.
Questions marketers ask
Did advertising help small businesses survive COVID-19 lockdowns?
The evidence points that way. Across 49 countries, lockdown orders increased closure risk less for firms that had advertised on Facebook than for those that had not, although the authors describe the result as directional and correlational (Lee et al., 2025).
Is it wise to keep advertising when sales collapse?
The authors suggest not. Because advertising builds recognition and customer ties that pay off later, they see keeping or even increasing social media spend during a crisis as a counterintuitive but possibly wise choice.
Does spending more on ads make a difference?
In these records, yes, directionally. The biggest spenders saw the smallest rise in closure risk, and the pattern held when each firm's budget was replaced by the average spend of local rivals in the same line of business.
Which businesses gained most from advertising during lockdowns?
Firms with fewer than ten employees showed the clearest advantage, and retail and construction looked like the biggest winners among sectors. In transport the difference was close to nil, and in agriculture, a small slice of the sample, the sign reversed.
Is this proof that Facebook ads keep businesses open?
No. Advertisers may differ from other firms in ways the survey did not capture, such as financial health or age, so some of the difference may come from who chooses to advertise, not from the ads themselves.
Machine learning pulled design features out of Instagram posts from major fashion brands, and a count model linked each feature to likes. Putting a link in a post turned users off, while adding more images to the same post generally helped. Luxury and mass-market audiences split: luxury followers preferred clean product shots without influencers or busy backdrops, while mass-market followers engaged more with celebrity faces and attractive settings. A post that suits one brand can be wrong for its neighbour on the rail.
A frame-by-frame machine learning scan of 2,754 TikTok videos from 50 leading brands, posted over three years, found that simply showing a human face lifted engagement, and larger faces lifted it further. How long the face stayed on screen, and whether the brand sold pleasure or practicality, shaped the size of that lift. Likes, comments and shares did not all respond alike, so it pays to know which of the three a video is meant to win.
Source
Lee, S.-Y., Runge, J., Yoo, D., Bart, Y., Gyurak, A., & Schneider, J. W. (2025). Social Media Advertising's Role in Small Business Resilience Amid Lockdowns. Journal of Interactive Marketing, 60(4), 362-376. https://doi.org/10.1177/10949968251336683
This brief is written for practitioners from the published article. Open access (CC BY-NC 4.0): free to read at the publisher. Numbers are as reported by the authors; read the article for full methods.
A detailed "this person does not exist" label cut the sense of being manipulated and raised the sense of artificiality. The two effects cancelled out, except among younger viewers.
In the Ferragni and Balocco case, 96% of journalists' tweets were about the influencer. Consumers followed the press, and the brand barely got mentioned.
Handing customers a ready-made post lifted sharing from 0.4% to 2.1% in a real gym campaign, and, less visibly, stopped unhappy customers posting at all. How to use it, and where it gets uncomfortable.
Bruno Schivinski is Associate Professor of Marketing at Gdańsk University of Technology. He studies how consumers engage with brands in digital and social media.